
The Issue With Tiebreakers
Nobody reads the tiebreaker rules until they need them, and by then the argument is already over.
The Big 12 publishes seven steps for settling a tie at the top of the league. Four of the seven are some version of look at who they played. On paper that is airtight and slightly boring. In reality the ladder does its job for a two-team tie, mostly does its job for a three-team tie, and then at four teams it stops being a tiebreaker at all - it becomes a schedule tiebreaker. The team that played the harder slate goes, whether or not it earned it.
So we played the 2026 Big 12 season 100,000 times and counted which step is the one that actually decides first and second place. Not who wins the league. Which rule does the work. 100,000 seasons, 120 games each, 12,000,000 games total, and every one of them resolved by the same code that runs the conference-title odds on this site.
How this ran
Blank slate. All sixteen teams start 0-0 and every regular-season game involving a Big 12 team gets replayed - 72 conference games plus 48 non-conference games, because step five is total wins and not conference wins.
Games are priced off one rating snapshot (home field 2.5 points, neutral sites zero, so nothing is priced off a stale preseason number), and the standings are ordered by the same tiebreaker engine the site uses. Every simulated season is checked against the engine's own order before it counts. Run the whole thing priced off our model instead of SP+ and the numbers move a few points without changing shape: 75.6% of seasons need a tiebreak on that price, and step four still decides a berth in 11.8% of them.
The rules, in English
- Head to head.
- Record against common conference opponents.
- Record against the next-highest common opponent, walking down the standings.
- Combined conference winning percentage of everybody you played.
- Total wins, with an FCS win counting once.
- The SportSource rating.
- Coin toss.
For three or more tied teams the rule seeds one team and then restarts the entire list on whoever is left. Keep that in your pocket, because it is why the race for the second spot behaves differently than the race for the first.
Most seasons need one tiebreak; one in six needs two
A season can burn zero, one or two of them. Two clear qualifiers is zero. A two-way tie at the top, or a clear leader with a tie underneath, is one. Three or more sharing the best record is two, because the rule seeds first place and then restarts the entire cascade for the second - and that is the case worth watching. Across the 100,000 seasons the average was 0.95 tiebreaks per season:
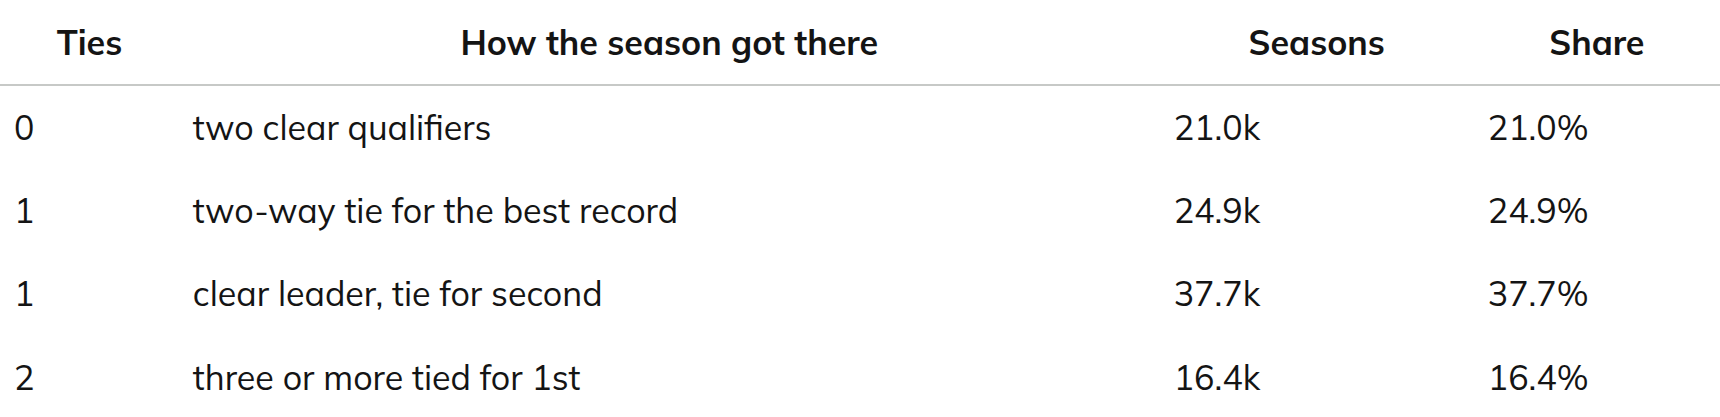
So 79.0% of seasons needed at least one tiebreak, and 16.4% needed two. The top of the table is usually clean - 58.7% of seasons produced a solo conference leader - and still, in those seasons the fight for the second berth went to a tiebreak 64.2% of the time. This is not a once-a-decade curiosity that gets dusted off in a year where four teams finish 7-2.
The ties themselves: 24.9% of seasons ended with two teams sharing the best record, 10.7% with three, 4.2% with four, then it thins out fast - roughly one season in a thousand produced a seven-way tie for the best record. Below is what decides first place, split by how many teams were tied. The bold number in each row is the rule that did the deciding.
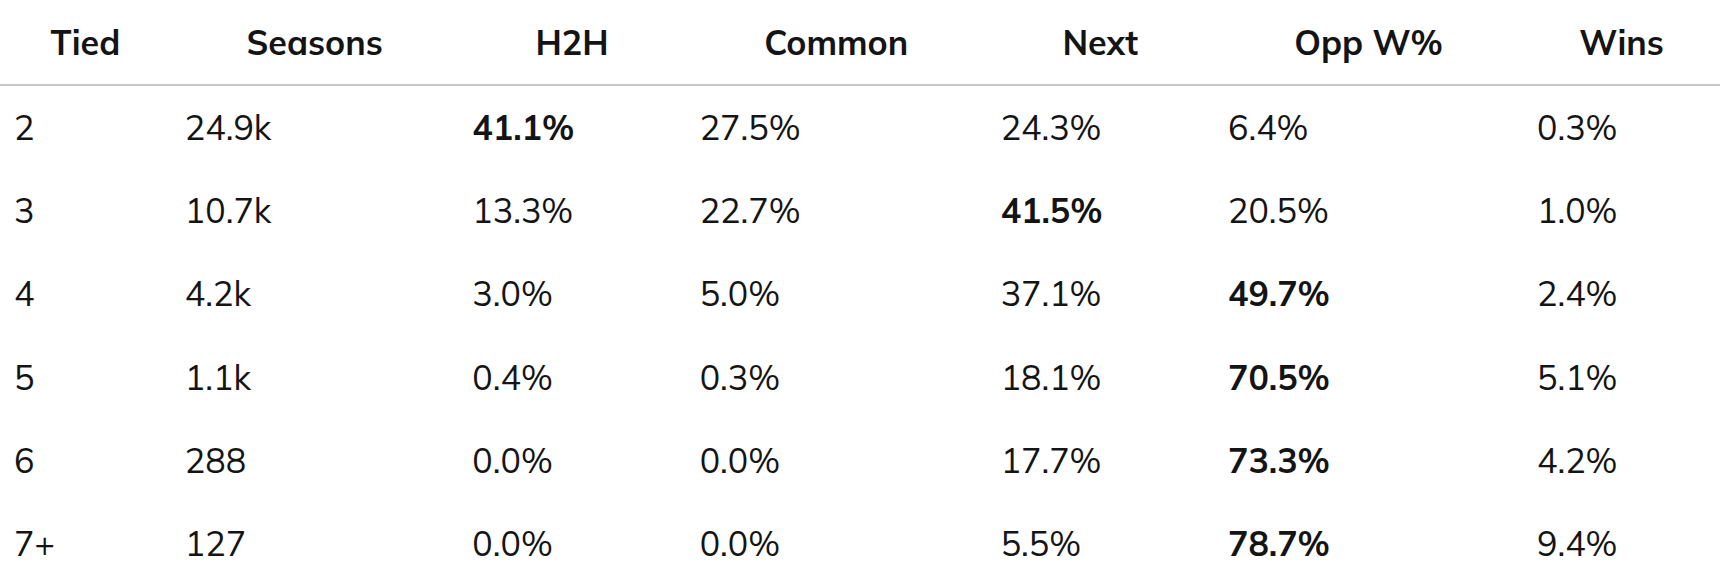
H2H is head to head, Common is record against common opponents, Next is the next-highest common opponent, Opp W% is opponents' conference win percentage, Wins is total wins.
Steps one through three are fine
Two teams tied: head to head settles 41.1% of them, and when the two have not actually played, common opponents and the next-highest comparison pick up almost all of the rest. Only 6.4% of two-team ties ever reach the strength-of-schedule step. That is how the rule is supposed to work.
Three teams tied, and the ladder still holds: head to head separates far fewer of them (13.3%), but step three - record against the next-highest common opponent - does the heavy lifting at 41.5%. Strength of schedule is a bit player here too, at 20.5%.
If the Big 12 only ever had two- and three-team ties, this piece does not get written.
Four is where the wheels come off
Steps two and three both need the tied teams to have played the same opponents. At four teams that stops happening. Here is how often the common-opponent step runs and finds nothing to compare:
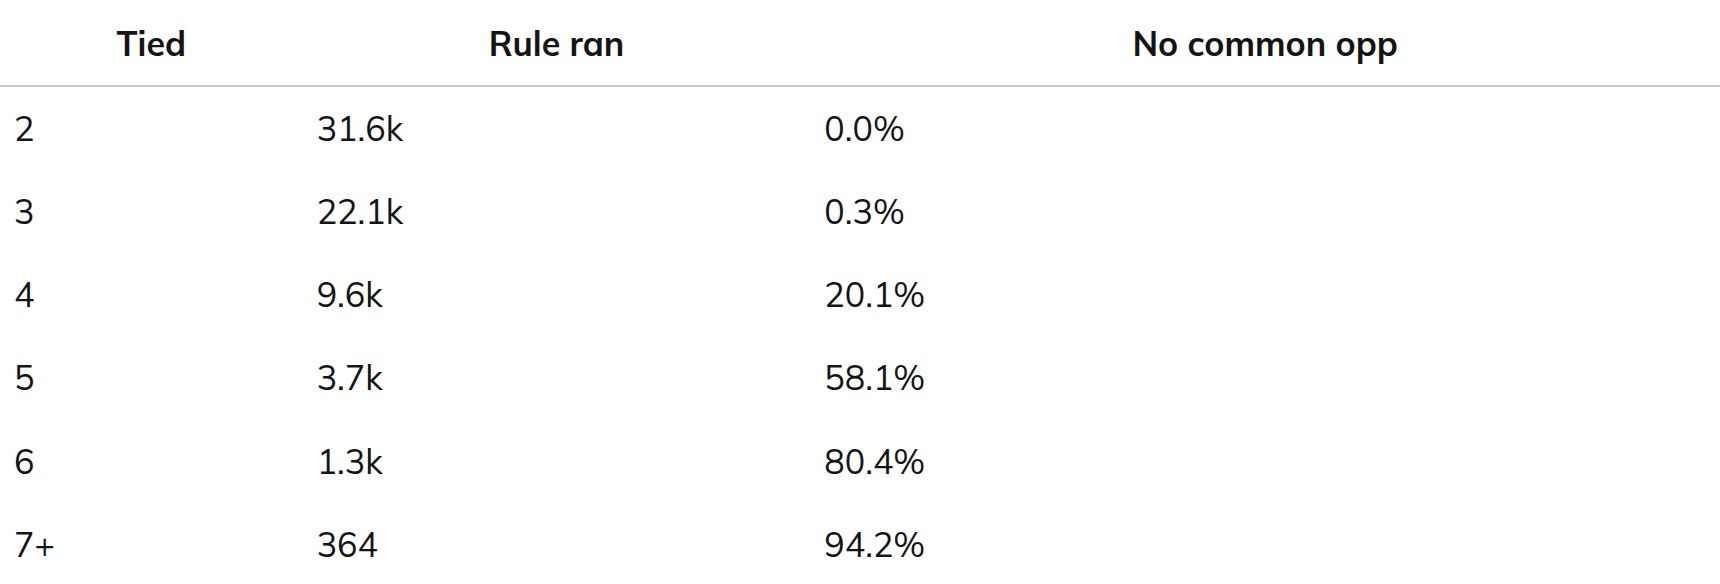
At two teams it is literally impossible to come up empty - every pair in this league shares at least two conference opponents. At four teams it happens one time in five. At six teams it happens four times in five. And when the comparison set is empty, the rule does not stop and think; it falls straight through to step four, the combined conference winning percentage of your opponents.
Which is exactly what the deciding-rule table shows. Ties of four or more are settled by opponents' conference win percentage 49.7% of the time at four teams, 70.5% at five, 73.3% at six, and 78.7% at seven or more. The document says tiebreakers are about what you did. At that size it is about who you happened to play.
Why it collapses
A Big 12 team plays nine of the fifteen possible conference opponents. That is plenty for two teams to have shared company and enough for three. It is not enough for four teams to all have played the same somebody. Do the math on random nine-of-fifteen schedules and a four-way intersection is a rounding error; with this league's actual clustering it is worse than random.
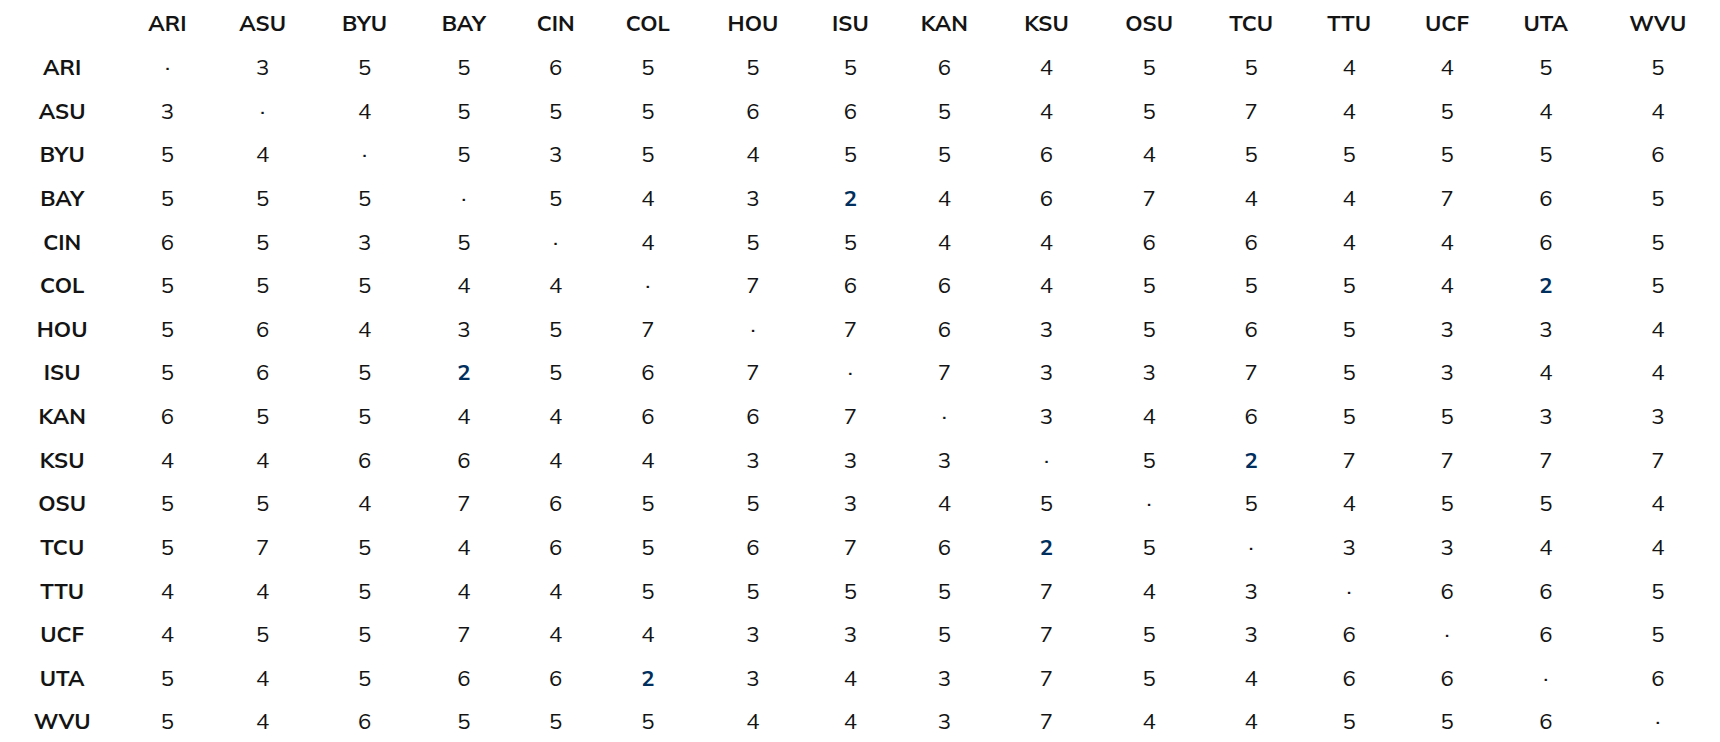
We pulled the whole schedule and counted shared opponents for all 120 team pairs. Mean 4.80 common opponents, median five, max seven, and the floor - Colorado and Utah, Baylor and Iowa State, Kansas State and TCU - is two. 17 of the 120 pairs share three or fewer, and not one pair shares zero.
That is the part worth sitting with. The pairwise crossover is fine everywhere. The failure is the group: nine games out of fifteen cannot intersect across four or more teams, and the rule needs exactly that.
Here is the whole matrix, common conference opponents for every pair, so you can see it yourself. Colors are not doing any work - lower is thinner.
The size of the problem
At least one berth went to opponents' conference win percentage in 14.6% of all seasons - one season in seven, about once a year and a half of Big 12 football. Split by spot it is 6.9% of first places and 8.5% of second places, which understates it, because a season only needs it to bite once.
And inside a tie of four or more, the step decides half to four-fifths of the berths. In the specific case where a lone leader sits above a four-team fight for the last spot, it is a coin flip between step three at 41.7% and step four at 42.5%. And when a seven-way tie does happen, 78.7% of the time the berth goes to the team whose opponents won the most games.
The seven-way at 7-2
Seven teams at 7-2 is not a hypothetical. It showed up 101 times in 100,000 seasons, about one in a thousand. A bigger sample run says those seven-way ties land at 6-3 about as often as 7-2, while the three- and four-team ties are almost always 7-2 - 79% and 95% of them.
So the chaos scenario is real, just rare. And it is also the exact scenario the rulebook handles worst: seven teams, seven schedules, no common opponent for six of the seven, and the berth handed to whoever's opponents finished with the best conference record.
Let's talk about pods.
A fair objection to all of this: the tiebreak only matters so much because there are two berths. Put the Big 12 into a 24-team playoff, hand the champion one automatic bid and no conference title game, and the league only has to name one team. The second-place cascade disappears and the question narrows to: how often is the title shared, and which rule names the winner?
The title is shared in 41.3% of seasons. When it is, head to head names the champion 28.5% of the time, record against common opponents 23.0%, the next-highest comparison 29.8%, and opponents' conference win percentage 16.8%. Across all seasons the schedule-strength step picks the No. 1 seed 6.9% of the time. The one-berth world is meaningfully cleaner, which tells you a real share of the problem was always the second berth.
Now the schedule. The proposal on the table is four pods of four:
West: BYU, Utah, Arizona and Arizona State
South: TCU, Baylor, Texas Tech and Oklahoma State
Norht: Iowa State, Kansas, Kansas State and Colorado
East: Cincinnati, West Virginia, Houston and UCF
You play your three podmates, you play all four teams of one other pod (West with North, South with East), and you get one game against a team from each of the two pods left over. More guaranteed crossover, less of a scattered slate. We built that schedule, checked it satisfies every one of those rules, and ran the same 100,000 seasons through the same engine and the same rating snapshot.
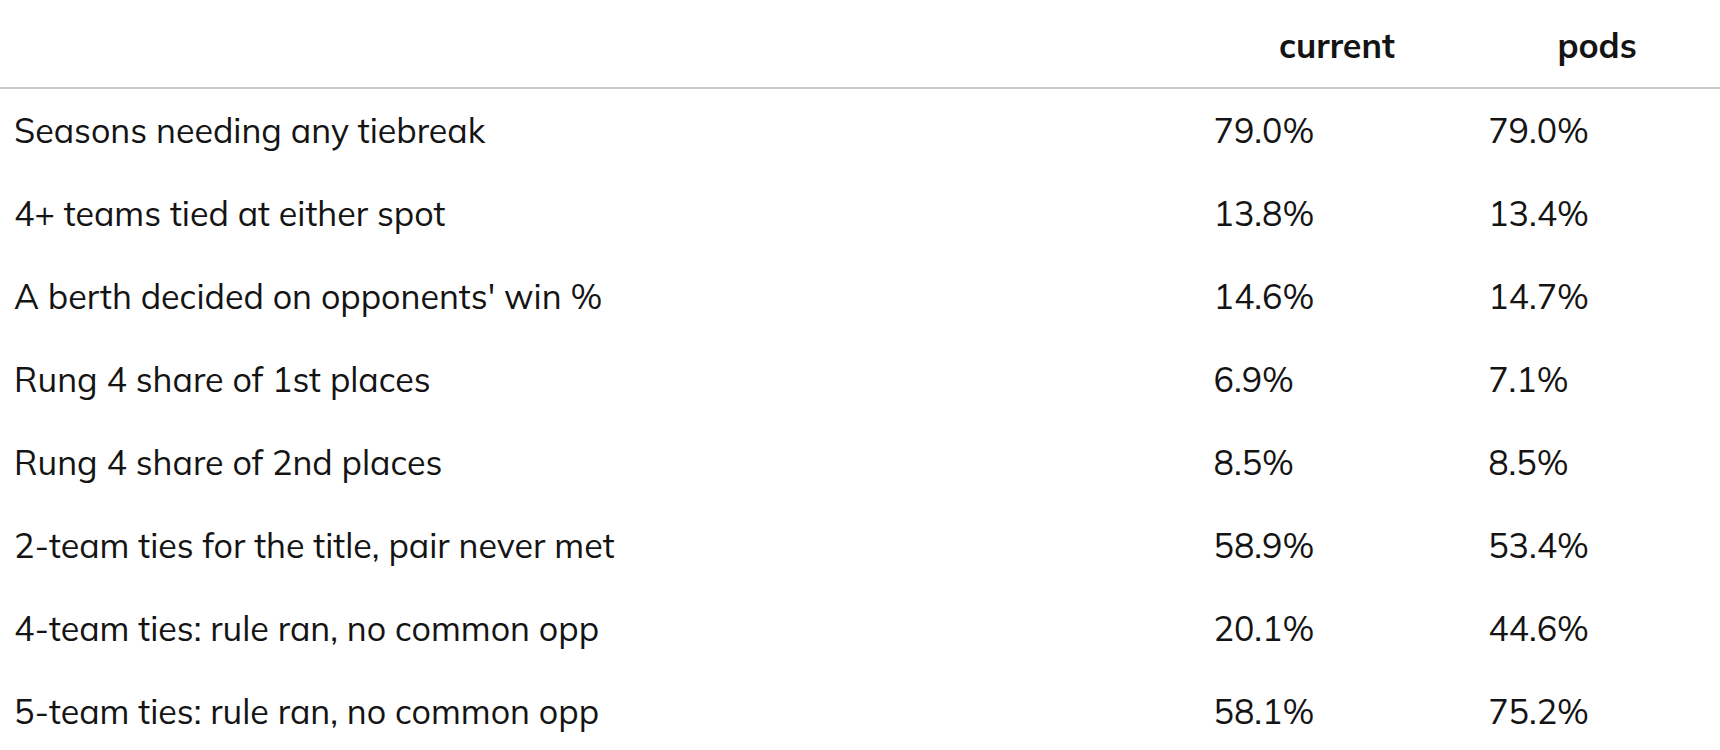
It's nearly identical until you get to 4 team ties. then you end up with SOS or other weird nonsense even moreso because while you have more crossover with your paired podmates, you have near complete isolation with the other two. Pods only help when you are running them as 2 divisions to determine a berth from each. For better or worse, the current scheduling setup of 1 protected rival is here to stay and so is our frustration with it.
Still want to see the Cougs play Arizona and ASU every year though.